Quadratic Functions!
Properties
Domain:
Range:
Roots:
Asymptotes:
Periodicity:
All Real Numbers
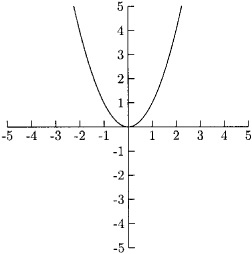
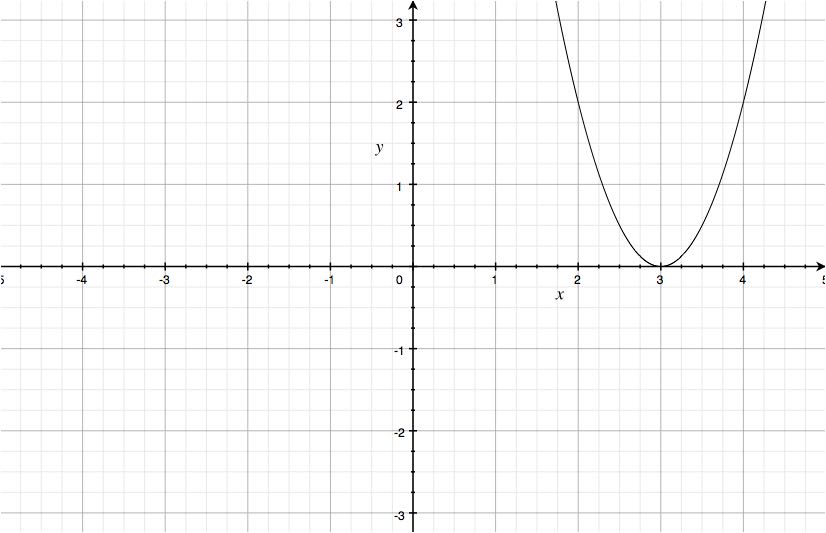
Range depends on the function; For the graph shown to the left, the range would be [0,infinity); The range is restricted to those points greater than or equal to the y-coordinate of the vertex (or less than or equal to, depending on whether the parabola opens up or down).
Where f(x) = 0
None
None
Description
x2 is positive, the
parabola opens up; otherwise it opens down. The vertex of the parabola is at the point at the bottom of the "U" shape (or the top, if the parabola
opens downward). The general form of a quadratic function is y=ax2+bx+c, where a can not be 0. x
is the variable, or unknown. The solutions to a quadratic function is where it is equal to zero. Typically, there are 2 solutions. These are also
called "roots" as seen above in properties section. There are three ways to find the solutions of a quadratic function: factor the quadratic,
complete the square, or using the quadratic formula.
Quadratic Formula
Reflection
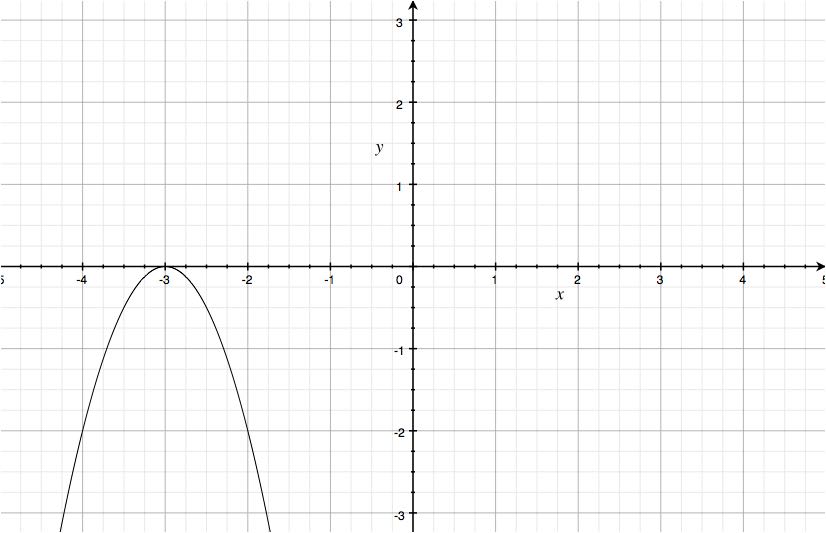
Over the x-axis
y=2(x+3)2
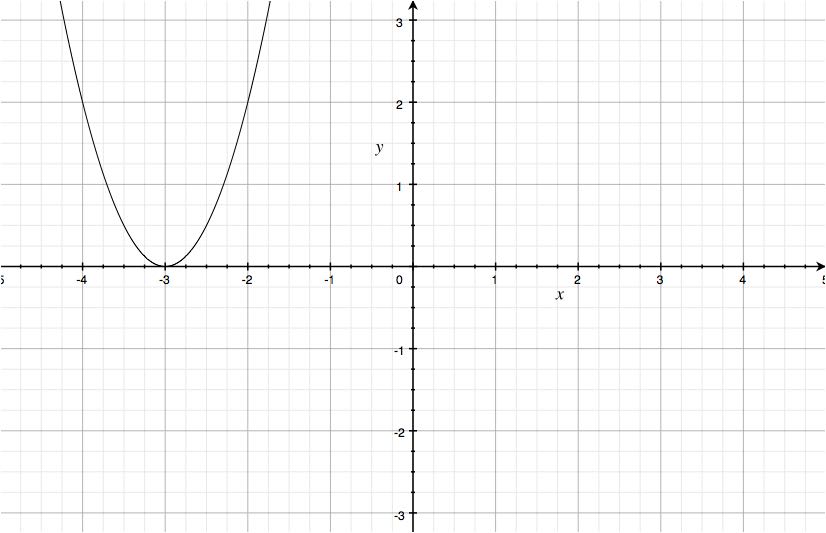
y=-2(x+3)2
Over the y-axis
y=2(x+3)2
y=2(x-3)2
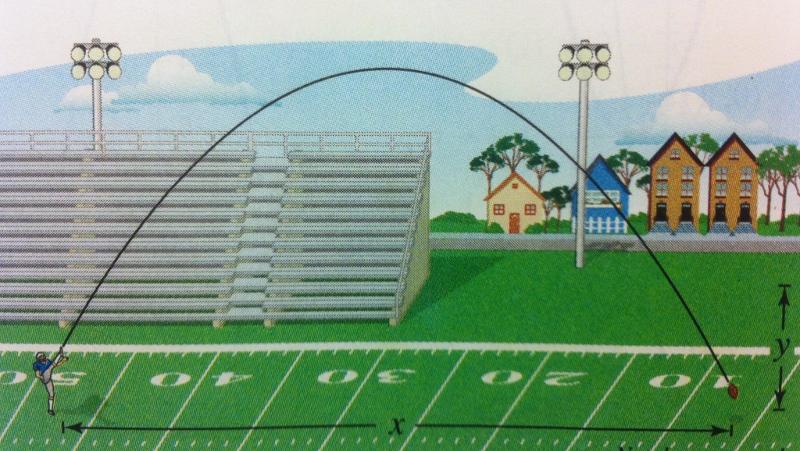
Real World Applications
The path a ball takes when thrown
The path an arrow takes when shot
Reflecting telescope or satellite dish shape
Can be used by economists
Representations
Picture
Words- An object is launched at 19.6 meters per second (m/s) from a 58.8-meter tall platform. The equation for the object's height s at time t seconds after launch is s(t) = –4.9t2 + 19.6t + 58.8, wheres is in meters.
Table
X
0
1
2
3
4
Y
2
-2
4
20
46
Graphs- see top of page
Formula (Symbolic)-
Standard Form: ax^2 + bx + c = 0
Vertex Form: f (x) = a(x - h)2 + k, where (h, k) is the vertex of the parabola
How To Graph:
Problems
-
Question) A water balloon is catapulted into the air so that its height h, in metres, after t seconds is
h=-4.9t2+27t+2.4.
a) How high is the balloon after 1 second? b) For how long is the balloon more than 30 m high? c) What is the maximum height of the balloon?
Answer) a) 24.5m b) 3 seconds c) 39.3m -
2. A model rocket is launched from the roof of a building. Its flight path is modeled by
h=-5t2+30t+10, where h is the height of the rocket above the ground in metres andtis the time after the launch in seconds. What is the rocket’s maximum height?
Answer) 55m
Standards
CCSS.MATH.CONTENT.HSF.LE.A.1 Distinguish between situations that can be modeled with linear functions and with exponential functions.
CCSS.MATH.CONTENT.HSF.LE.A.1.A Prove that linear functions grow by equal differences over equal intervals, and that exponential functions grow by equal factors over equal intervals.
CCSS.MATH.CONTENT.HSF.LE.A.1.B Recognize situations in which one quantity changes at a constant rate per unit interval relative to another.
CCSS.MATH.CONTENT.HSF.LE.A.1.C Recognize situations in which a quantity grows or decays by a constant percent rate per unit interval relative to another.
CCSS.MATH.CONTENT.HSF.LE.A.2 Construct linear and exponential functions, including arithmetic and geometric sequences, given a graph, a description of a relationship, or two input-output pairs (include reading these from a table).
CCSS.MATH.CONTENT.HSF.LE.A.3 Observe using graphs and tables that a quantity increasing exponentially eventually exceeds a quantity increasing linearly, quadratically, or (more generally) as a polynomial function.
All of these standards can be addressed using information on this website tab. For linear, exponential, and quadratic functions, the information needed to distinguish between these functions is available on the website. These are all standards that are expected to be covered when students are learning about these three types of functions. In the classroom, students could be given this website as a reference point for them to use to learn about these types of functions. It could also be used to help students complete their assignments or study guides. Using a website such as this one gives students a way to look for themselves at the information that they need. Also, assigning a project in which students make these websites is another great way to bring their knowledge about these functions up. Because these standards are asking about growth and decay, constructing functions, observing both graphs and tables, and distinguishing between various aspects of these functions, this website is a great way to cover all of the different pieces of these standards. Each of these standards is addressed in this website.
I think that this website does an excellent job of tying together these standards to student learning. For the first standard, it wants students to learn to distinguish between different types of functions. This is done in this website in the real world applications section, as well as the properties section. Students could look at the properties listed and match them to the function they are working with. For the second, third, and fourth standards, they want students to understand that different types of functions grow at different rates. In this website, you can look at the graph for each type of function and see the difference in change between the different functions. Students could also see the formula for the function and realize the difference. As far as learning to construct different types of functions, students could use the graph examples as well as the other representations such as table to help them learn to construct the graphs. Students could also use the formulas for each function type to help with this. Finally, it wants students to observe graphs and tables of different functions and note how the function is changing and which type it is. This is done again through looking at the graph, properties, tables, and other features of a function to determine which one is the best fit.