CCSS.MATH.CONTENT.HSF.LE.A.1 Distinguish between situations that can be modeled with linear functions and with exponential functions.
CCSS.MATH.CONTENT.HSF.LE.A.1.A Prove that linear functions grow by equal differences over equal intervals, and that exponential functions grow by equal factors over equal intervals.
CCSS.MATH.CONTENT.HSF.LE.A.1.B Recognize situations in which one quantity changes at a constant rate per unit interval relative to another.
CCSS.MATH.CONTENT.HSF.LE.A.1.C Recognize situations in which a quantity grows or decays by a constant percent rate per unit interval relative to another.
CCSS.MATH.CONTENT.HSF.LE.A.2 Construct linear and exponential functions, including arithmetic and geometric sequences, given a graph, a description of a relationship, or two input-output pairs (include reading these from a table).
CCSS.MATH.CONTENT.HSF.LE.A.3 Observe using graphs and tables that a quantity increasing exponentially eventually exceeds a quantity increasing linearly, quadratically, or (more generally) as a polynomial function.
All of these standards can be addressed using information on this website tab. For linear, exponential, and quadratic functions, the information needed to distinguish between these functions is available on the website. These are all standards that are expected to be covered when students are learning about these three types of functions. In the classroom, students could be given this website as a reference point for them to use to learn about these types of functions. It could also be used to help students complete their assignments or study guides. Using a website such as this one gives students a way to look for themselves at the information that they need. Also, assigning a project in which students make these websites is another great way to bring their knowledge about these functions up. Because these standards are asking about growth and decay, constructing functions, observing both graphs and tables, and distinguishing between various aspects of these functions, this website is a great way to cover all of the different pieces of these standards. Each of these standards is addressed in this website.
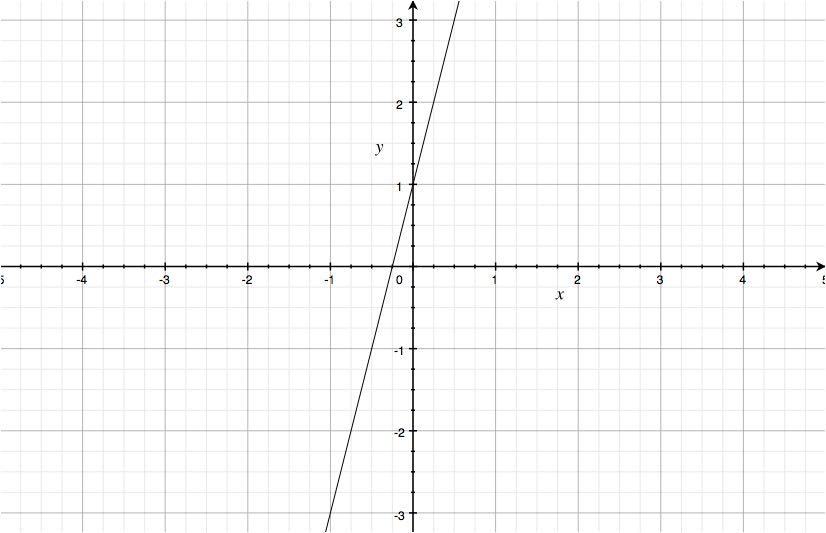
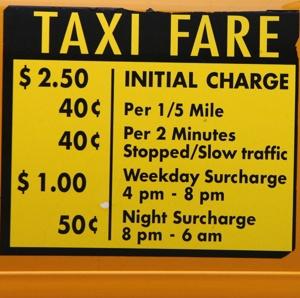
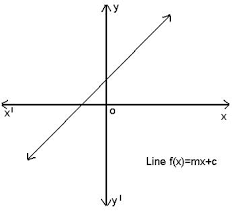
I think that this website does an excellent job of tying together these standards to student learning. For the first standard, it wants students to learn to distinguish between different types of functions. This is done in this website in the real world applications section, as well as the properties section. Students could look at the properties listed and match them to the function they are working with. For the second, third, and fourth standards, they want students to understand that different types of functions grow at different rates. In this website, you can look at the graph for each type of function and see the difference in change between the different functions. Students could also see the formula for the function and realize the difference. As far as learning to construct different types of functions, students could use the graph examples as well as the other representations such as table to help them learn to construct the graphs. Students could also use the formulas for each function type to help with this. Finally, it wants students to observe graphs and tables of different functions and note how the function is changing and which type it is. This is done again through looking at the graph, properties, tables, and other features of a function to determine which one is the best fit.
.gif) , or change in
, or change in